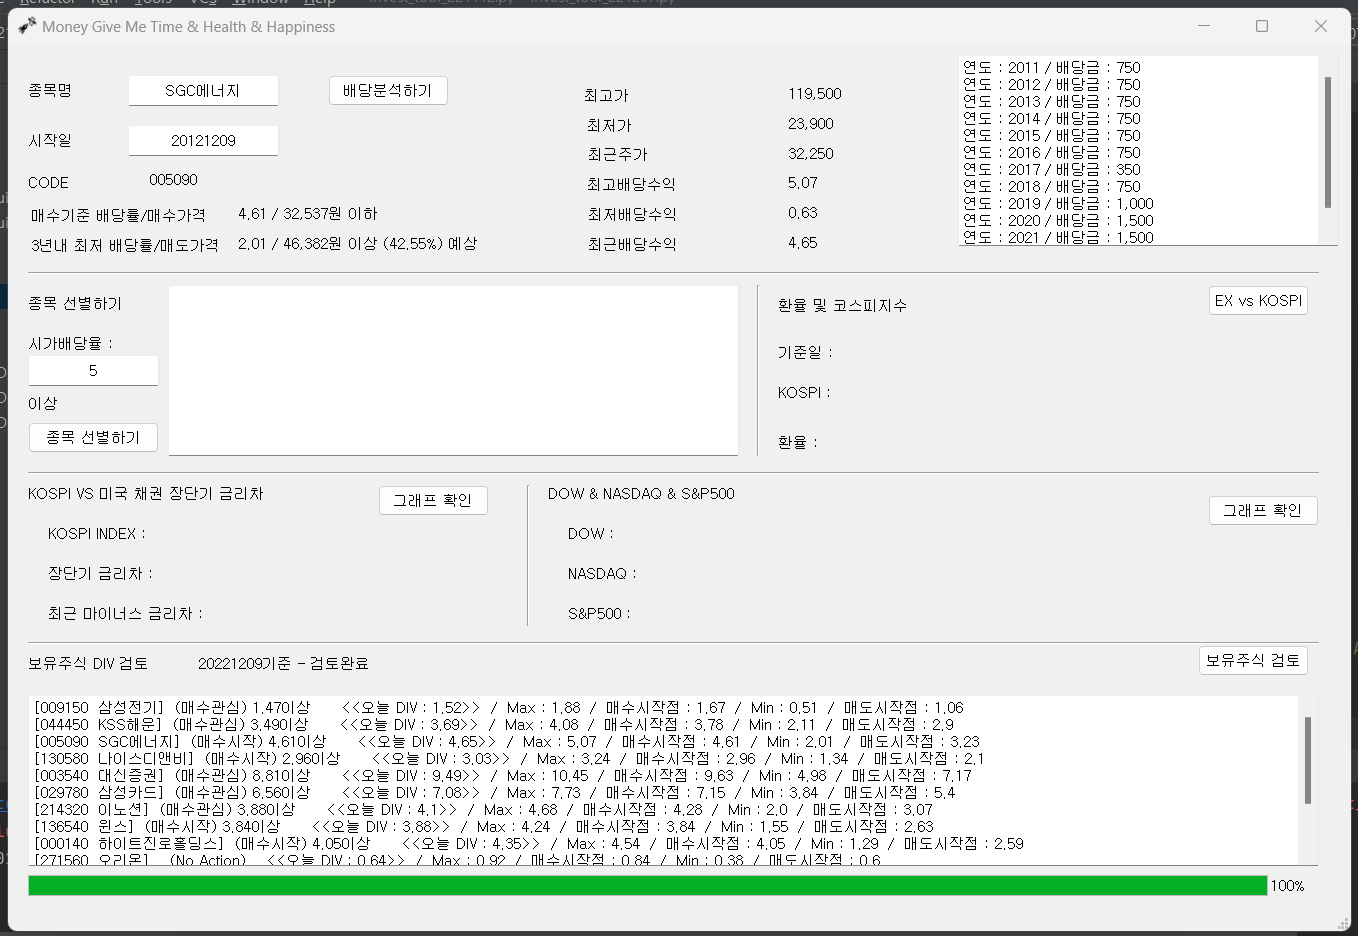
주식투자도구를 업데이트 했습니다.
매수기준 배당률과 매수를 해야할 가격, 3년내 최저 배당률과 매도를 해야할 가격을 표시했습니다. 거기에다 예상(최소) 수익률도 자동으로 계산이 되어서 표시 하도록 했습니다.
그리고 pykrx를 통해서 데이터를 가져온 후 분석을 하는 방식을 바꿔서 DB에 저장된 데이터를 기준으로 분석하도록 방법을 조금 변경했습니다.
또한, 도구창이 열리는 순간 DB에 데이터가 업데이트 되도록 코드를 수정했습니다.
별거 한 건 없는 것 같은데 에러가 계속 나서 오래걸렸습니다.
오래 걸린만큼 더욱 유용하리라 생각됩니다.
전체 코드는 아래와 같습니다.
|
1
2
3
4
5
6
7
8
9
10
11
12
13
14
15
16
17
18
19
20
21
22
23
24
25
26
27
28
29
30
31
32
33
34
35
36
37
38
39
40
41
42
43
44
45
46
47
48
49
50
51
52
53
54
55
56
57
58
59
60
61
62
63
64
65
66
67
68
69
70
71
72
73
74
75
76
77
78
79
80
81
82
83
84
85
86
87
88
89
90
91
92
93
94
95
96
97
98
99
100
101
102
103
104
105
106
107
108
109
110
111
112
113
114
115
116
117
118
119
120
121
122
123
124
125
126
127
128
129
130
131
132
133
134
135
136
137
138
139
140
141
142
143
144
145
146
147
148
149
150
151
152
153
154
155
156
157
158
159
160
161
162
163
164
165
166
167
168
169
170
171
172
173
174
175
176
177
178
179
180
181
182
183
184
185
186
187
188
189
190
191
192
193
194
195
196
197
198
199
200
201
202
203
204
205
206
207
208
209
210
211
212
213
214
215
216
217
218
219
220
221
222
223
224
225
226
227
228
229
230
231
232
233
234
235
236
237
238
239
240
241
242
243
244
245
246
247
248
249
250
251
252
253
254
255
256
257
258
259
260
261
262
263
264
265
266
267
268
269
270
271
272
273
274
275
276
277
278
279
280
281
282
283
284
285
286
287
288
289
290
291
292
293
294
295
296
297
298
299
300
301
302
303
304
305
306
307
308
309
310
311
312
313
314
315
316
317
318
319
320
321
322
323
324
325
326
327
328
329
330
331
332
333
334
335
336
337
338
339
340
341
342
343
344
345
346
347
348
349
350
351
352
353
354
355
356
357
358
359
360
361
362
363
364
365
366
367
368
369
370
371
372
373
374
375
376
377
378
379
380
381
382
383
384
385
386
387
388
389
390
391
392
393
394
395
396
397
398
399
400
401
402
403
404
405
406
407
408
409
410
411
412
413
414
415
416
417
418
419
420
421
422
423
424
425
426
427
428
429
430
431
432
433
434
435
436
437
438
439
440
|
import sys
from PyQt5.QtWidgets import *
from PyQt5 import uic
from PyQt5.QtGui import QIcon
from pykrx import stock
from datetime import datetime, timedelta
import matplotlib.pyplot as plt
import pandas as pd
from pandas_datareader import data as pdr
import FinanceDataReader as fdr
import time
import numpy as np
import sqlite3
import random
ui = 'INVEST TOOL_221208.ui'
class MainWindow(QMainWindow):
def __init__(self):
QMainWindow.__init__(self, None)
uic.loadUi(ui, self)
self.btn.clicked.connect(self.input_data)
self.btn_ex_kospi.clicked.connect(self.kospi_ex)
self.btn_div.clicked.connect(self.filtered_by_div)
self.btn_diff_tr.clicked.connect(self.diff_tr_kospi)
self.btn_dns.clicked.connect(self.dns)
self.btn_my_div.clicked.connect(self.my_div)
self.initUI()
# 창이 밋밋해서 아이콘도 넣었다.
def initUI(self):
self.setWindowIcon(QIcon('to_money.png'))
self.db_update() #시작하면 DB부터 업데이트
def input_data(self):
con = sqlite3.connect('krx_data.db')
today_df = pd.read_sql("SELECT 일자 FROM fundamental", con) # DB에서 마지막 행 구하기
today = today_df['일자'].iloc[-1] # 마지막 행에서 날짜 구하기
print(today)
# 이름을 받아서 code 입력
def code_by_name(name):
code_df = pd.read_sql("SELECT 일자, code, 종목명 FROM fundamental WHERE 종목명 = '" + name + "' AND 일자 = "
+ today, con)
return code_df['code'].iloc[-1]
name = self.le_name.text()
code = code_by_name(name)
self.textEdit.clear()
self.lbl_code.setText(code)
if not self.le_start.text(): #le_start 가 비었으면
start_df = pd.read_sql("SELECT code, 일자 FROM fundamental WHERE code = '" + code + "'", con)
start_date = start_df['일자'].iloc[0]
if int(today[:4]) - 10 < int(start_date[:4]): #과거 10년 데이터가 없으면
print('10년전 데이터가 없음')
if int(today[4:6]) > 5: #첫번째 데이터 일자가 5월보다 크면 그 다음해부터 시작
start = str(int(start_date[:4]) + 1) + '0101'
else:
start = start_date
print(start)
else:
start = str(int(today[:4]) - 10) + today[-4:] # 10년전 날짜
print('10년전 데이터가 있음')
else:
start = self.le_start.text() #아니면 원하는 날짜에 시작
# 년도별 배당금 표시하기
dps_li = []
try:
i = 1
for y in range(int(start[:4]), int(today[:4]) + 1):
df_f = pd.read_sql("SELECT code, 일자, DPS FROM fundamental WHERE code = '" + code +
"' AND 일자 LIKE " + "'" + str(y) + '05%' + "'", con)
prb = int(i)/((int(today[:4]) + 1) - int(start[:4])) * 100 #Progress Bar
self.prb.setValue(prb) #Progress Bar
dps = int(df_f['DPS'].iloc[-1]) # 배당금을 dps 변수에 저장
dps_li.append([y - 1, dps]) # 년도와 배당금을 리스트로 저장(년도는 전년도로 저장)
i += 1
except:
pass
print(dps_li)
for data in dps_li:
exist = self.textEdit.toPlainText()
self.textEdit.setText(exist + '연도 : ' + str(data[0]) + ' / 배당금 : ' + str(format(data[1], ",")) + '\n')
# 주가, 배당수익률 비교 그래프
df = pd.read_sql("SELECT code, 일자, 종가, DIV FROM fundamental WHERE code = '" + code + "' AND 일자 >= " + start,
con)
df['일자'] = pd.to_datetime(df['일자'])
df = df.set_index('일자')
df = df[['종가', 'DIV']]
df.columns = ['price', 'DIV']
today_s = datetime.today()
today_s = datetime.strftime(today_s, '%Y%m%d') # 오늘일자를 str으로
start_s = str(int(today_s[:4]) - 3) + today_s[-4:] # 3년전 날짜(파는 것은 좀 더 보수적으로 하기 위해 짧게 잡기)
df_s = pd.read_sql("SELECT 일자, code, 종목명, DIV FROM fundamental WHERE code = '" + code + "'" +
" AND 일자 >= " + start_s, con) # 3년을 기준으로 한 Dataframe
p_max = str(format(df['price'].max(), ","))
p_min = str(format(df['price'].min(), ","))
d_max = str(round(df['DIV'].max(), 2))
d_min = str(round(df['DIV'].min(), 2))
price = str(format(df['price'].iloc[-1], ","))
div = str(round(df['DIV'].iloc[-1], 2))
div_min = str(round(df_s['DIV'].min(), 2)) # 3년내 최소값
div_base = str(round((float(d_max) - float(div_min)) * 0.85 + float(div_min), 2)) # 매수를 할 기준값
p_base = int(dps_li[-1][1] / float(div_base) * 100) #매수 기준가격 계산
sell_base = int(dps_li[-1][1] / ((float(d_max)-float(div_min)) * 0.4 + float(div_min)) * 100) #매도시작 기준가격 계산
profit = round(((sell_base / p_base) - 1) * 100, 2) #수익률 계산
print(profit)
self.lbl_pmax.setText(p_max) #기간내 최고주가
self.lbl_pmin.setText(p_min) #기간내 최저주가
self.lbl_dmax.setText(d_max) #기간내 최고 DIV
self.lbl_dmin.setText(d_min) #기간내 최저 DIV
self.lbl_price.setText(price) #최근주가
self.lbl_div.setText(div) #최근 배당수익률
self.le_start.setText(start) #데이터 시작일
self.lbl_buy.setText(div_base + ' / ' + format(p_base, ",") + '원 이하') #매수기준 배당률 및 매수가격
self.lbl_3ymin.setText(div_min + ' / ' + format(sell_base, ",") + '원 이상 (' +
str(profit) + '%) 예상') #3년기준 최저 배당률 및 매도가격
plt.rcParams['figure.figsize'] = (16, 9)
fig, ax1 = plt.subplots()
ax1.set_xlabel('Date')
ax1.set_ylabel('price')
ax1.plot(df.index, df['price'], color='red', label='Price')
ax1.legend(loc='upper left')
ax2 = ax1.twinx()
ax2.set_ylabel('DIV')
ax2.plot(df.index, df['DIV'], color='blue', label='DIV')
ax2.legend(loc='upper right')
plt.title(name)
plt.show()
def kospi_ex(self):
ex = pdr.get_data_yahoo('USDKRW=X', '2000-01-04') # 환율데이터 가져오기
kospi = pdr.get_data_yahoo('^KS11', '2000-01-04') # KOSPI 데이터 가져오기
df = pd.DataFrame({'KOSPI': kospi['Adj Close'], 'Exchange': ex['Adj Close']})
df.dropna(inplace=True)
plt.rcParams['figure.figsize'] = (16, 9)
fig, ax1 = plt.subplots()
ax1.set_xlabel('DATE')
ax1.set_ylabel('KOSPI')
ax1.plot(df.index, df['KOSPI'], color='red', label='KOSPI INDEX')
ax1.legend(loc='upper right')
ax2 = ax1.twinx()
ax2.set_ylabel('Exchange Rate')
ax2.plot(df.index, df['Exchange'], color='blue', label='Exchange Rate')
ax2.legend(loc='lower right')
plt.title('Exchange Rate VS KOSPI Index')
exchange = round(df['Exchange'][-1], 2)
kospi_index = round(df['KOSPI'][-1], 2)
date = df.index[-1]
self.lbl_date.setText(str(date))
self.lbl_kospi.setText(str(kospi_index))
self.lbl_ex.setText(str(exchange))
plt.show()
# 배당수익률을 기준으로 종목 선정하기
def filtered_by_div(self):
self.db_update()
con = sqlite3.connect('krx_data.db')
div = self.le_div.text()
# 과거 10년간의 Dataframe 구하기
def filter_by_period(today, ticker):
start = str(int(today[:4]) - 10) + today[-4:]
end = str(today)
df = pd.read_sql("SELECT 일자, code, 종목명, DIV, DPS FROM fundamental WHERE code = '" + ticker + "'" +
" AND 일자 >= " + start + " AND 일자 < " + end, con)
return df
div = self.le_div.text()
today_df = pd.read_sql("SELECT 일자 FROM fundamental ORDER BY ROWID DESC LIMIT 1", con)
# DB에서 마지막 행 구하기
today = today_df['일자'].iloc[0] # 마지막 행에서 날짜 구하기
today_df = pd.read_sql("SELECT 일자, code, 종목명, DIV, DPS, EPS FROM fundamental WHERE 일자 = "
+ today + " AND EPS > 0" + " AND DPS > 0 AND DIV > " +
str(div), con)
# 오늘 날짜 기준으로 Data를 분석하기
to_see_codes = []
count = 0
for code in today_df['code']:
try:
print(len(today_df['code']) - count)
t_df = today_df[today_df['code'] == code]
name = t_df['종목명'].iloc[0]
t_div = t_df['DIV'].iloc[0] # 기준일자의 DIV
df = filter_by_period(today, code)
m = int(len(df['DPS']) / 2)
if df['DPS'].iloc[0] <= df['DPS'].iloc[-1] and df['DPS'].iloc[0] != 0 and \
df['DPS'].iloc[m] <= df['DPS'].iloc[-1]:
if (df['DIV'].max() - df['DIV'].min()) * 0.9 < t_div:
to_see_codes.append([today, code, name, t_div])
except:
pass
count += 1
self.prb.setValue(int(count/len(today_df)*100))
total_df = pd.DataFrame(data=to_see_codes, columns=['기준일', 'Code', '종목명', '배당률'])
print(total_df)
for i in range(len(total_df)):
print(i)
exist = self.te_div.toPlainText()
self.te_div.setText(exist + '기준일 : ' + str(total_df['기준일'].iloc[i]) +
' / CODE : ' + str(total_df['Code'].iloc[i]) +
' / 종목명 : ' + str(total_df['종목명'].iloc[i]) +
' / 배당률 : ' + str(round(total_df['배당률'].iloc[i], 2)) + '\n')
total_df.to_excel('배당률로 선별한 종목 DIV ' + str(div) + '이상' + today + '.xlsx')
# 장단기 미국채권 금리차와 코스피지수 비교
def diff_tr_kospi(self):
kospi = pdr.get_data_yahoo('^KS11', '2000-01-04')
print(kospi)
T10Y2Y = fdr.DataReader('T10Y2Y', '2000-01-04', data_source='fred') # 미국 장단기 금리차
print(T10Y2Y)
df = pd.DataFrame({'KOSPI': kospi['Adj Close'], 'T10Y2Y': T10Y2Y['T10Y2Y']})
df.dropna(inplace=True)
self.lbl_kospi_index.setText(str('{:0,.2f}'.format(int(df['KOSPI'].iloc[-1])))) # 최근 코스피지수
self.lbl_diff_tr.setText(str(round(df['T10Y2Y'].iloc[-1], 2))) # 최근 미국채권 장단기금리 차
minus_df = df[df['T10Y2Y'] < 0] # 금리가 역전된 최근 일자의 데이터 프레임
self.lbl_diff_rate.setText(str('{0:,.2f}'.format(minus_df['T10Y2Y'].iloc[-1]))) # 최근 마이너스 금리차
self.lbl_diff_date.setText(datetime.strftime(minus_df.index[-1], '%Y%m%d')) # 최근 금리차 역전된 날짜
plt.rcParams['figure.figsize'] = (16, 9)
fig, ax1 = plt.subplots()
ax1.set_xlabel('DATE')
ax1.set_ylabel('KOSPI')
ax1.plot(df.index, df['KOSPI'], color='red', label='KOSPI INDEX')
ax1.legend(loc='upper right')
ax2 = ax1.twinx()
ax2.set_ylabel('T10Y2Y')
ax2.plot(df.index, df['T10Y2Y'], color='blue', label='10Y - 2Y Treasury')
ax2.legend(loc='upper left')
plt.title('USA 10Year-2Year Treasury VS KOSPI')
plt.show()
# DOW, NASDAQ, S&P500 지수 보여주기
def dns(self):
dow = pdr.get_data_yahoo('^DJI', '2000-01-04')
snp = pdr.get_data_yahoo('^GSPC', '2000-01-04')
nasdaq = pdr.get_data_yahoo('^IXIC', '2000-01-04')
df = pd.DataFrame({'DOW': dow['Adj Close'], 'S&P500': snp['Adj Close'], 'NASDAQ': nasdaq['Adj Close']})
self.lbl_dow.setText(str('{:0,.2f}'.format(df['DOW'].iloc[-1])))
self.lbl_snp.setText(str('{:0,.2f}'.format(df['S&P500'].iloc[-1])))
self.lbl_nasdaq.setText(str('{:0,.2f}'.format(df['NASDAQ'].iloc[-1])))
plt.rcParams['figure.figsize'] = (16, 9)
fig, ax1 = plt.subplots()
ax1.set_xlabel('DATE')
ax1.set_ylabel('DOW, NASDAQ')
ax1.plot(df.index, df['DOW'], color='red', label='DOW')
ax1.plot(df.index, df['NASDAQ'], color='blue', label='NASDAQ')
ax1.legend(loc='upper left')
ax2 = ax1.twinx()
ax2.set_ylabel('S&P500')
ax2.plot(df.index, df['S&P500'], color='black', label='S&P500')
ax2.legend(loc='center right')
plt.title('DOW & NASDAQ & S&P500')
plt.show()
# DB 업데이트
def db_update(self):
con = sqlite3.connect('krx_data.db')
# 오늘날짜 기준으로 아직 받지않은 Data를 DB에 다운로드 받기
# 영업일을 List로 가져오기
def make_date_list(start, end):
start = datetime.strptime(start, '%Y%m%d')
end = datetime.strptime(end, '%Y%m%d')
dates = [(start + timedelta(days=i)).strftime('%Y%m%d') for i in range((end - start).days + 1)]
b_dates = []
for d in dates:
b_day = stock.get_nearest_business_day_in_a_week(d)
if not b_day in b_dates:
b_dates.append(b_day)
s = random.randint(1, 3)
time.sleep(s)
return b_dates
# Data를 다운로드 받기
def data_download(date):
codes = stock.get_market_ticker_list(date, market='ALL') # code list 만들기
corp = [] # Code와 Name을 저장할 List
for code in codes:
name = stock.get_market_ticker_name(code) # 종목 이름 가져오기
corp.append([code, name]) # Code와 이름으로 리스트를 만들기
df1 = pd.DataFrame(data=corp, columns=['code', '종목명']) # code와 종목명을 데이터프레임으로 만들기
df1.index = df1['code'] # index를 코드로 만들기
df_f = stock.get_market_fundamental_by_ticker(date=date,
market='ALL') # BPS, PER, PBR, EPS, DIV, DPS 가져와서 데이터 프레임 만들기
df_c = stock.get_market_cap_by_ticker(date=date, market='ALL') # 종가, 시가총액, 거래량, 거래대금, 상장주식수 가져오기
time.sleep(1)
df = pd.merge(df1, df_c, left_index=True, right_index=True) # 종목명, 종가, 시가총액, 거래량, 거래대금, 상장주식수
df = pd.merge(df, df_f, left_index=True, right_index=True) # 위에 df + PER, PBR...
# column은 '종목명', '종가', '시가총액', '거래량', '거래대금', '상장주식수', 'BPS', 'PER', 'PBR', 'EPS', 'DIV', 'DPS'
df['일자'] = np.array([date] * len(df))
df = df.set_index('일자')
return df
# DB에서 마지막 행 구하기
db_last_df = pd.read_sql("SELECT 일자, code, 종목명, DIV, DPS FROM fundamental ORDER BY ROWID DESC LIMIT 1", con)
db_last_date = db_last_df['일자'].iloc[0] # 마지막 행에서 날짜 구하기
db_last_date = datetime.strptime(db_last_date, '%Y%m%d')
start_date = (db_last_date + timedelta(days=1)).strftime('%Y%m%d')
# 오늘날짜 구하기
today = datetime.today().strftime('%Y%m%d')
end_date = stock.get_nearest_business_day_in_a_week(today, prev=True)
# 데이터 받아서 데이터프레임으로 합치고, DB에 저장
if start_date < end_date:
try:
dates = make_date_list(start_date, end_date)
print(dates)
for n, date in enumerate(dates):
print(date)
if n == 0:
t_df = data_download(date)
else:
t_df = pd.concat([t_df, data_download(date)])
time.sleep(1) # 혹시나 차단될 수 있으니깐
print(t_df)
con = sqlite3.connect("krx_data.db")
t_df.to_sql('fundamental', con, if_exists='append')
except:
pass
# 보유주식 검토
def my_div(self):
con = sqlite3.connect('krx_data.db')
today = datetime.today()
today = datetime.strftime(today, '%Y%m%d') # 오늘일자를 str으로
start = str(int(today[:4]) - 10) + today[-4:] # 10년전 날짜
start_s = str(int(today[:4]) -3) + today[-4:] # 3년전 날짜(파는 것은 좀 더 보수적으로 하기 위해 짧게 잡기)
codes = ['009150', '044450', '005090', '130580', '003540', '029780', '214320', '136540', '000140',
'271560', '005380', '005930', '002990']
i = 1
for code in codes:
df = pd.read_sql("SELECT 일자, code, 종목명, DIV FROM fundamental WHERE code = '" + code + "'" +
" AND 일자 >= " + start, con) #10년을 기준으로 한 Dataframe
df_s = pd.read_sql("SELECT 일자, code, 종목명, DIV FROM fundamental WHERE code = '" + code + "'" +
" AND 일자 >= " + start_s, con) #3년을 기준으로 한 Dataframe
name = df['종목명'].iloc[-1]
div_max = round(df['DIV'].max(), 2) #검토기간 중 가장 높은 값
div_today = round(df['DIV'].iloc[-1], 2) #오늘기준 배당률
div_min = round(df_s['DIV'].min(), 2) #최소값
div_base = round((div_max - div_min) * 0.85 + div_min, 2) # 매수를 할 기준값
div_min_base = round((div_max-div_min) * 0.4 + div_min, 2) #매도할 기준값
print(name + ' 85% :' + str(round((div_max - div_min) * 0.85 + div_min, 2)))
print(name + ' 80% :' + str(round((div_max - div_min) * 0.8 + div_min, 2)))
print(name + ' 70% :' + str(round((div_max - div_min) * 0.7 + div_min, 2)))
print(name + ' 40% :' + str(round((div_max - div_min) * 0.4 + div_min, 2)))
print(name + ' 30% :' + str(round((div_max - div_min) * 0.3 + div_min, 2)))
print(name + ' 20% :' + str(round((div_max - div_min) * 0.2 + div_min, 2)))
# 매수, 매도, 보유 판단하기
if div_max <= div_today:
comment = ' (적극매수) '
elif (div_max-div_min) * 0.85 + div_min <= div_today:
comment = '(매수시작) ' + str(round((div_max-div_min) * 0.85 + div_min, 2)) + '이상 '
elif (div_max-div_min) * 0.7 + div_min <= div_today:
comment = '(매수관심) ' + str(round((div_max-div_min) * 0.7 + div_min, 2)) + '이상 '
elif (div_max-div_min) * 0.4 + div_min > div_today:
comment = '(20% 매도시작) ' + str(round((div_max-div_min) * 0.4 + div_min, 2)) + '이하 '
elif (div_max-div_min) * 0.3 + div_min > div_today:
comment = '(40% 매도시작) ' + str(round((div_max-div_min) * 0.3 + div_min, 2)) + '이하 '
elif (div_max-div_min) * 0.2 + div_min > div_today:
comment = '(60% 매도시작) ' + str(round((div_max-div_min) * 0.2 + div_min, 2)) + '이하 '
elif (div_max-div_min) * 0.1 + div_min > div_today:
comment = '(80% 매도시작) ' + str(round((div_max-div_min) * 0.1 + div_min, 2)) + '이하 '
elif div_min >= div_today:
comment = ' (전량매도) '
else:
comment = ' (No Action) '
# TextEdit에 표시
exist = self.te_my_div.toPlainText()
self.te_my_div.setText(exist + '[' + code + ' ' + name + '] ' + comment + ' <<오늘 DIV : ' +
str(div_today) + '>> / Max : ' + str(div_max) + ' / 매수시작점 : ' +
str(div_base) + ' / Min : ' + str(div_min) + ' / 매도시작점 : ' +
str(div_min_base) + '\n')
self.prb.setValue(int(i / len(codes) * 100)) # 진행 상태바 표시
i += 1
today_df = pd.read_sql("SELECT 일자 FROM fundamental ORDER BY ROWID DESC LIMIT 1", con) # DB에서 마지막 행 구하기
today = today_df['일자'].iloc[0] # 마지막 행에서 날짜 구하기
self.lbl_my_today.setText(today + '기준 - 검토완료')
if __name__ == '__main__':
app = QApplication(sys.argv)
Window = MainWindow()
Window.show()
app.exec_()
|
cs |
728x90
'파이썬(Python) > 배당투자를 위한 도구' 카테고리의 다른 글
| Tool 업데이트 221231 (0) | 2022.12.31 |
|---|---|
| 주식투자 툴 업그레이드 (0) | 2022.12.26 |
| 주식투자 Tool 업데이트 (0) | 2022.12.04 |
| 주식투자 보조 도구(Tool) (1) | 2022.11.29 |
| Invest Tool Upadate - 소소한 업데이트 (4) | 2022.11.21 |


댓글