
주식투자 분석툴을 업데이트 했다.
해야지, 해야지 하다가 최근 몇 주간 열심히 코딩을 해서 우선 현재까지 완성했다.(나중에 더 업데이트가 될 수도 있지만....)
예전에 만든 원하는 종목에 대한 배당분석은 변경된 건 없다.

연도별 배당금이 표시되고, 분석 기간동안의 최고가, 최저가, 최근주가, 최고, 최저, 최근 배당수익율이 표시된다.
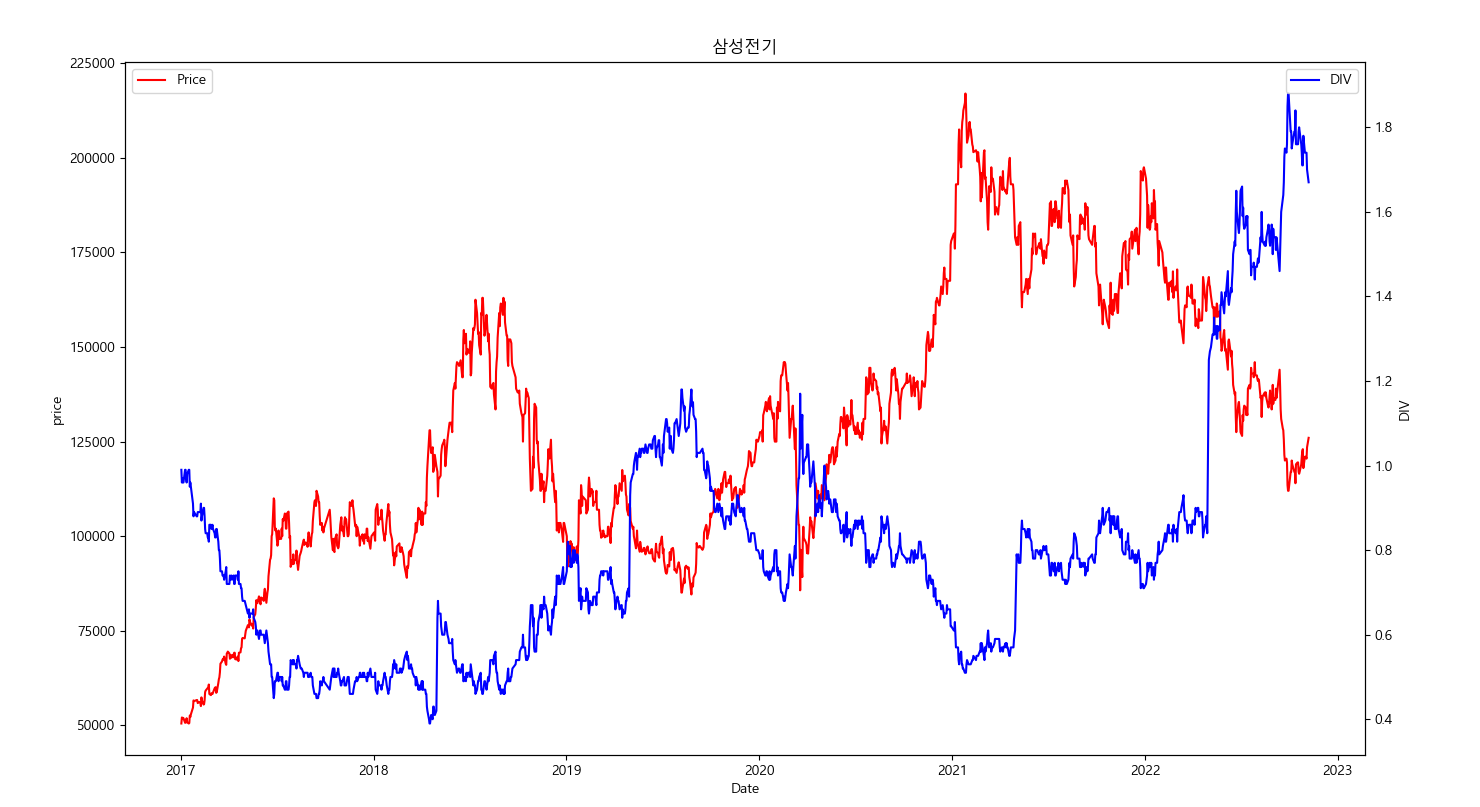
그리고 Trend 를 볼 수 있도록 그래프도 만들어진다.
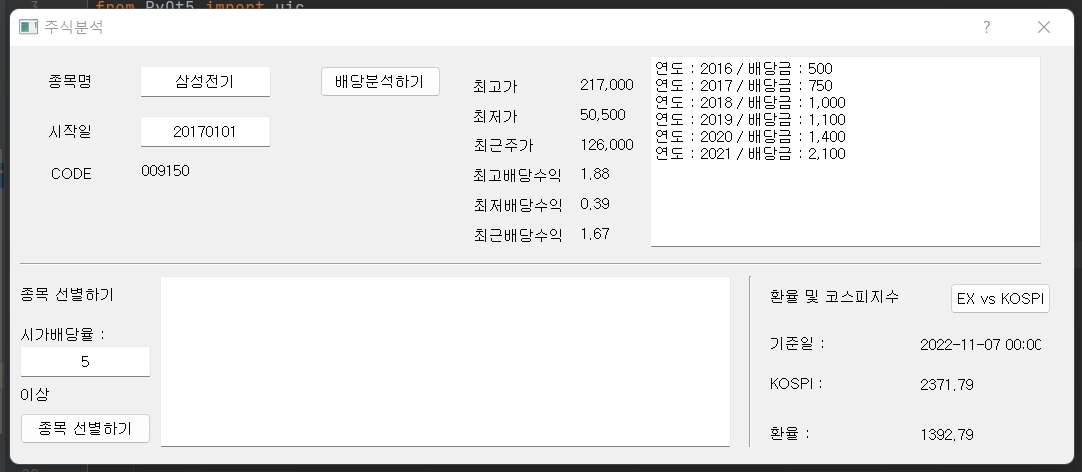
환율 및 코스피지수는 추가된 항목이다.
기준일과 KOSPI, 환율을 최근 기준으로 스크래핑해서 보여준다.

환율 VS 코스피지수도 트렌드를 보기위해 그래프가 나타난다.
주식투자를 하면서 느끼지만, 금리, 환율 이런것들이 상당히 중요하다.
갑자기 생각 난건데 금리, 유가 이런 것들도 업데이트해야겠다.
마지막으로 추가된 항목은 배당률을 이용해서 종목을 선별하는 툴이다.
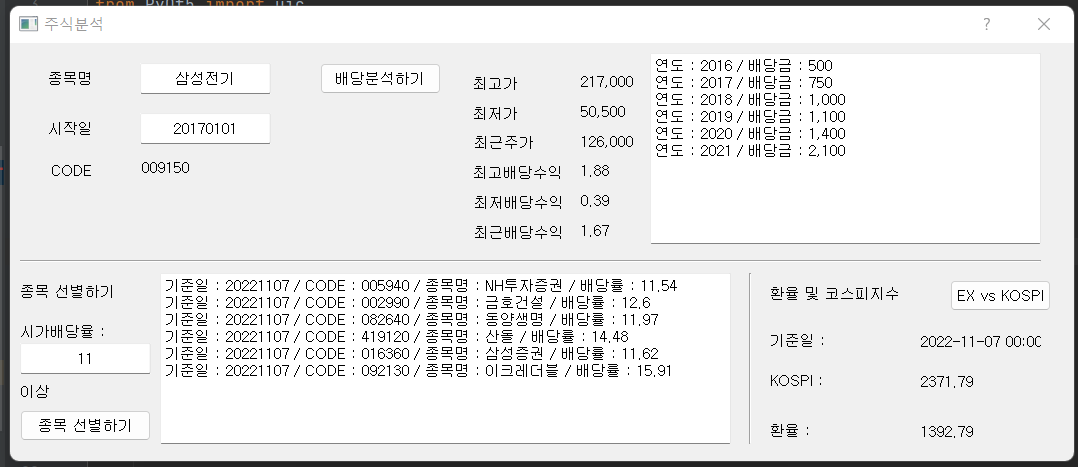
원하는 시가 배당률을 입력하면, 그 이상의 종목들만 1차 선별이 된다. 그리고 과거 5년치 최고 시가배당수익률의 90%가 넘는 종목들만 추려진다. 당연히 EPS가 0 이상인 조건들이라 작년에 수익이 난 종목만 나온다.

선별한 종목은 엑셀파일에 저장이 된다.
이 툴은 개인적으로 '클루지(Kluge)'라 생각든다.
클루지라는 책에서 본 단어인데, 어설프거나 세련되지 않은 해결책이라는 뜻이다.
맥가이버가 주변의 도구로 어려움에서 탈출하는 방법이 한 마디로 '클루지'다.
내가 봐도 이 툴은 어설프다. 하지만, 나에게 상당히 유용하다. 투자에 많은 도움이 된다.
|
1
2
3
4
5
6
7
8
9
10
11
12
13
14
15
16
17
18
19
20
21
22
23
24
25
26
27
28
29
30
31
32
33
34
35
36
37
38
39
40
41
42
43
44
45
46
47
48
49
50
51
52
53
54
55
56
57
58
59
60
61
62
63
64
65
66
67
68
69
70
71
72
73
74
75
76
77
78
79
80
81
82
83
84
85
86
87
88
89
90
91
92
93
94
95
96
97
98
99
100
101
102
103
104
105
106
107
108
109
110
111
112
113
114
115
116
117
118
119
120
121
122
123
124
125
126
127
128
129
130
131
132
133
134
135
136
137
138
139
140
141
142
143
144
145
146
147
148
149
150
151
152
153
154
155
156
157
158
159
160
161
162
163
164
165
166
167
168
169
170
171
172
173
174
175
176
177
178
179
180
181
182
183
184
185
186
187
188
189
190
191
192
193
194
195
196
197
198
199
200
201
202
203
204
205
206
207
208
209
210
211
212
213
214
215
216
217
218
219
220
221
222
223
224
225
226
227
228
229
230
231
232
233
234
235
236
237
238
239
240
241
242
243
244
245
246
247
248
249
250
251
252
253
254
255
256
257
258
259
260
261
262
263
264
265
266
267
268
269
270
271
272
273
274
275
276
277
278
279
280
|
import sys
from PyQt5.QtWidgets import *
from PyQt5 import uic
from pykrx import stock
from datetime import datetime, timedelta
import matplotlib.pyplot as plt
import pandas as pd
from pandas_datareader import data as pdr
import time
import numpy as np
import sqlite3
import random
ui = '투자분석기.ui'
class MainDialog(QDialog):
def __init__(self):
QDialog.__init__(self, None)
uic.loadUi(ui, self)
self.btn.clicked.connect(self.input_data)
self.btn_ex_kospi.clicked.connect(self.kospi_ex)
self.btn_div.clicked.connect(self.filtered_by_div)
def input_data(self):
end = str(datetime.today()).split('-')
end = end[0] + end[1] + end[2][:2] # 날짜를 'yyyymmdd' str 형태로 변환
print(end)
# 이름을 받아서 code 입력
def code_by_name(name, date):
codes = stock.get_market_ticker_list(date, market='ALL')
li_code = []
for code in codes:
company = stock.get_market_ticker_name(code)
li_code.append(company)
dic_code = dict(zip(li_code, codes))
if name in dic_code:
code = dic_code[name]
return code
name = self.le_name.text()
code = code_by_name(name, end)
self.textEdit.clear()
self.lbl_code.setText(code)
if not self.le_start.text(): #le_start 가 비었으면
start = int(end[:4])-5 #5년 전부터 시작
start = str(start) + '0101'
else:
start = self.le_start.text() #아니면 원하는 날짜에 시작
df_f = stock.get_market_fundamental(start[:4] + '1230', end, code, freq='y') # BPS, PER, PBR, EPS, DIV, DPS
df_f = df_f['DPS']
# 년도별 배당금 표시하기
dps_li = []
try:
for y in range(int(start[:4]), int(end[:4]) + 1):
day = stock.get_nearest_business_day_in_a_week(str(y) + '0530')
df_f = stock.get_market_fundamental_by_ticker(date=day, market='ALL') # BPS, PER, PBR, EPS, DIV, DPS
df_f = df_f.loc[code] # 원하는 종목의 코드에 해당하는 데이터만 필터
print(df_f)
dps = int(df_f['DPS']) # 배당금을 dps 변수에 저장
dps_li.append([y - 1, dps]) # 년도와 배당금을 리스트로 저장(년도는 전년도로 저장)
except:
pass
print(dps_li)
for data in dps_li:
exist = self.textEdit.toPlainText()
self.textEdit.setText(exist + '연도 : ' + str(data[0]) + ' / 배당금 : ' + str(format(data[1], ",")) + '\n')
# 주가, 배당수익률 비교 그래프
df_f = stock.get_market_fundamental(start, end, code, freq='d') # BPS, PER, PBR, EPS, DIV, DPS
name = stock.get_market_ticker_name(code)
df_f = df_f['DIV']
df_p = stock.get_market_ohlcv(start, end, code)
df_p = df_p['종가']
df_t = pd.merge(df_p, df_f, left_index=True, right_index=True)
df_t.columns = ['price', 'DIV']
p_max = str(format(df_t['price'].max(),","))
p_min = str(format(df_t['price'].min(),","))
d_max = str(round(df_t['DIV'].max(), 3))
d_min = str(round(df_t['DIV'].min(), 3))
price = str(format(df_t['price'].iloc[-1],","))
div = str(round(df_t['DIV'].iloc[-1], 3))
self.lbl_pmax.setText(p_max)
self.lbl_pmin.setText(p_min)
self.lbl_dmax.setText(d_max)
self.lbl_dmin.setText(d_min)
self.lbl_price.setText(price)
self.lbl_div.setText(div)
self.le_start.setText(start)
plt.rcParams['figure.figsize'] = (16, 9)
fig, ax1 = plt.subplots()
ax1.set_xlabel('Date')
ax1.set_ylabel('price')
ax1.plot(df_t.index, df_t['price'], color='red', label='Price')
ax1.legend(loc='upper left')
ax2 = ax1.twinx()
ax2.set_ylabel('DIV')
ax2.plot(df_t.index, df_t['DIV'], color='blue', label='DIV')
ax2.legend(loc='upper right')
plt.title(name)
plt.show()
def kospi_ex(self):
ex = pdr.get_data_yahoo('USDKRW=X', '2000-01-04') # 환율데이터 가져오기
kospi = pdr.get_data_yahoo('^KS11', '2000-01-04') # KOSPI 데이터 가져오기
df = pd.DataFrame({'KOSPI': kospi['Adj Close'], 'Exchange': ex['Adj Close']})
df.dropna(inplace=True)
plt.rcParams['figure.figsize'] = (16, 9)
fig, ax1 = plt.subplots()
ax1.set_xlabel('DATE')
ax1.set_ylabel('KOSPI')
ax1.plot(df.index, df['KOSPI'], color='red', label='KOSPI INDEX')
ax1.legend(loc='upper right')
ax2 = ax1.twinx()
ax2.set_ylabel('Exchange Rate')
ax2.plot(df.index, df['Exchange'], color='blue', label='Exchange Rate')
ax2.legend(loc='lower right')
plt.title('Exchange Rate VS KOSPI Index')
exchange = round(df['Exchange'][-1], 2)
kospi_index = round(df['KOSPI'][-1], 2)
date = df.index[-1]
self.lbl_date.setText(str(date))
self.lbl_kospi.setText(str(kospi_index))
self.lbl_ex.setText(str(exchange))
plt.show()
# 배당수익률을 기준으로 종목 선정하기
def filtered_by_div(self):
con = sqlite3.connect('krx_data.db')
# 오늘날짜 기준으로 아직 받지않은 Data를 DB에 다운로드 받기
# 영업일을 List로 가져오기
def make_date_list(start, end):
start = datetime.strptime(start, '%Y%m%d')
end = datetime.strptime(end, '%Y%m%d')
dates = [(start + timedelta(days=i)).strftime('%Y%m%d') for i in range((end - start).days + 1)]
b_dates = []
for d in dates:
b_day = stock.get_nearest_business_day_in_a_week(d)
if not b_day in b_dates:
b_dates.append(b_day)
s = random.randint(1, 3)
time.sleep(s)
return b_dates
# Data를 다운로드 받기
def data_download(date):
codes = stock.get_market_ticker_list(date, market='ALL') # code list 만들기
corp = [] # Code와 Name을 저장할 List
for code in codes:
name = stock.get_market_ticker_name(code) # 종목 이름 가져오기
corp.append([code, name]) # Code와 이름으로 리스트를 만들기
df1 = pd.DataFrame(data=corp, columns=['code', '종목명']) # code와 종목명을 데이터프레임으로 만들기
df1.index = df1['code'] # index를 코드로 만들기
df_f = stock.get_market_fundamental_by_ticker(date=date,
market='ALL') # BPS, PER, PBR, EPS, DIV, DPS 가져와서 데이터 프레임 만들기
df_c = stock.get_market_cap_by_ticker(date=date, market='ALL') # 종가, 시가총액, 거래량, 거래대금, 상장주식수 가져오기
time.sleep(1)
df = pd.merge(df1, df_c, left_index=True, right_index=True) # 종목명, 종가, 시가총액, 거래량, 거래대금, 상장주식수
df = pd.merge(df, df_f, left_index=True, right_index=True) # 위에 df + PER, PBR...
# column은 '종목명', '종가', '시가총액', '거래량', '거래대금', '상장주식수', 'BPS', 'PER', 'PBR', 'EPS', 'DIV', 'DPS'
df['일자'] = np.array([date] * len(df))
df = df.set_index('일자')
return df
# DB에서 마지막 행 구하기
db_last_df = pd.read_sql("SELECT 일자, code, 종목명, DIV, DPS FROM fundamental ORDER BY ROWID DESC LIMIT 1", con)
db_last_date = db_last_df['일자'].iloc[0] # 마지막 행에서 날짜 구하기
db_last_date = datetime.strptime(db_last_date, '%Y%m%d')
start_date = (db_last_date + timedelta(days=1)).strftime('%Y%m%d')
# 오늘날짜 구하기
today = datetime.today().strftime('%Y%m%d')
end_date = stock.get_nearest_business_day_in_a_week(today, prev=True)
# 데이터 받아서 데이터프레임으로 합치고, DB에 저장
if start_date < end_date:
try:
dates = make_date_list(start_date, end_date)
print(dates)
for n, date in enumerate(dates):
print(date)
if n == 0:
t_df = data_download(date)
else:
t_df = pd.concat([t_df, data_download(date)])
time.sleep(1) # 혹시나 차단될 수 있으니깐
print(t_df)
con = sqlite3.connect("krx_data.db")
t_df.to_sql('fundamental', con, if_exists='append')
except:
pass
# 과거 5년간의 Dataframe 구하기
def filter_by_period(today, ticker):
start = str(int(today[:4]) - 5) + today[-4:]
end = str(today)
df = pd.read_sql("SELECT 일자, code, 종목명, DIV, DPS FROM fundamental WHERE code = '" + ticker + "'" +
" AND 일자 >= " + start + " AND 일자 < " + end, con)
return df
div = self.le_div.text()
today_df = pd.read_sql("SELECT 일자 FROM fundamental ORDER BY ROWID DESC LIMIT 1", con)
# DB에서 마지막 행 구하기
today = today_df['일자'].iloc[0] # 마지막 행에서 날짜 구하기
today_df = pd.read_sql("SELECT 일자, code, 종목명, DIV, DPS, EPS FROM fundamental WHERE 일자 = "
+ today + " AND EPS > 0" + " AND DPS > 0 AND DIV > " +
str(div), con)
# 오늘 날짜 기준으로 Data를 분석하기
to_see_codes = []
count = 0
for code in today_df['code']:
try:
print(len(today_df['code']) - count)
t_df = today_df[today_df['code'] == code]
name = t_df['종목명'].iloc[0]
t_div = t_df['DIV'].iloc[0] # 기준일자의 DIV
df = filter_by_period(today, code)
m = int(len(df['DPS']) / 2)
if df['DPS'].iloc[0] <= df['DPS'].iloc[-1] and df['DPS'].iloc[0] != 0 and \
df['DPS'].iloc[m] <= df['DPS'].iloc[-1]:
if df['DIV'].max() * 0.9 < t_div:
to_see_codes.append([today, code, name, t_div])
except:
pass
count += 1
total_df = pd.DataFrame(data=to_see_codes, columns=['기준일', 'Code', '종목명', '배당률'])
print(total_df)
for i in range(len(total_df)):
print(i)
exist = self.te_div.toPlainText()
self.te_div.setText(exist + '기준일 : ' + str(total_df['기준일'].iloc[i]) +
' / CODE : ' + str(total_df['Code'].iloc[i]) +
' / 종목명 : ' + str(total_df['종목명'].iloc[i]) +
' / 배당률 : ' + str(round(total_df['배당률'].iloc[i], 2)) + '\n')
total_df.to_excel('배당률로 선별한 종목 DIV ' + str(div) + '이상' + today + '.xlsx')
if __name__ == '__main__':
app = QApplication(sys.argv)
Dialog = MainDialog()
Dialog.show()
app.exec_()
|
cs |
'파이썬(Python) > 배당투자를 위한 도구' 카테고리의 다른 글
| 주식분석도구 업그레이드 - 보유주식검토, 상태바 추가 (1) | 2022.11.18 |
|---|---|
| 배당률을 이용한 백테스트 결과 분석 (0) | 2022.11.16 |
| 주식투자 분석 툴 업데이트 2(With Python) (2) | 2022.11.15 |
| 배당수익률로 종목 선정하기 Update (With Python) (0) | 2022.11.11 |
| 배당수익률을 이용한 투자전략 백테스트 (1) | 2022.11.08 |


댓글